Bitcoin Chart
Browse Bitcoin price data using our candlestick chart in different resolutions and time-frames.
View →Browse Bitcoin charts, on-chain metrics, market cycles, and price analysis tools.
Browse Bitcoin price data using our candlestick chart in different resolutions and time-frames.
View →
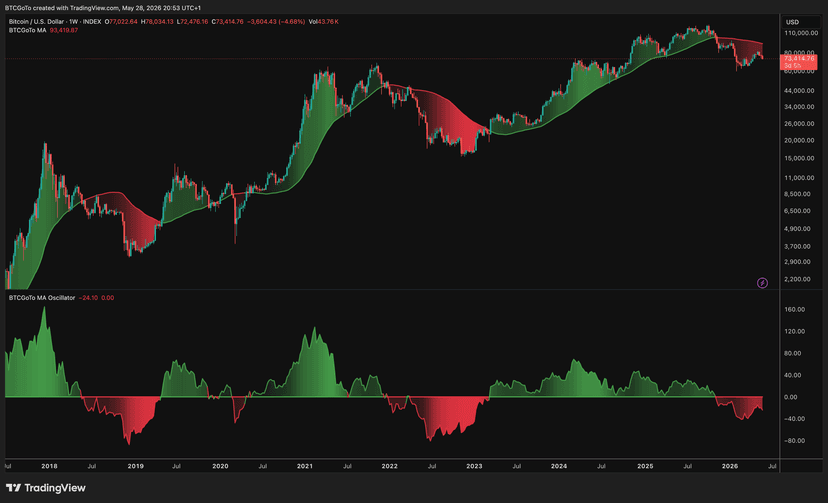
BTCGoTo moving averages and more — beautiful scripts for TradingView, starting with our Moving Average suite.
View →Illustrated cheat sheet — reversals, continuations, triangles, flags, wedges, and more with neckline and S/R overlays.
View →
Scan 15m–weekly Bitcoin charts for flags, triangles, wedges, doubles, and more — with overlays and watch-list notes.
View →
Bullish, bearish, or neutral at a glance — 15m through weekly with regression trend lines on each horizon.
View →
Ask about Bitcoin charts, cycles, patterns, and on-chain data — free preview, unlimited for Premium.
View →
Keep updated with what is happening in the cryptosphere — check out recent news stories.
View →Explore Bitcoin market cycles from market bottom to the next cycle bottom.
View →
Where are we in the cycle? Live readings, bullish/bearish labels, and cycle stage across macro models.
View →

Scarcity model overlay through halving epochs — educational context chart.
View →
Latest Bitcoin price and percentage change for daily, weekly, monthly, and yearly periods.
View →
Historical Bitcoin price table with change over multiple time horizons.
View →
Rainbow logarithmic regression chart to explore long-term Bitcoin growth curves.
View →